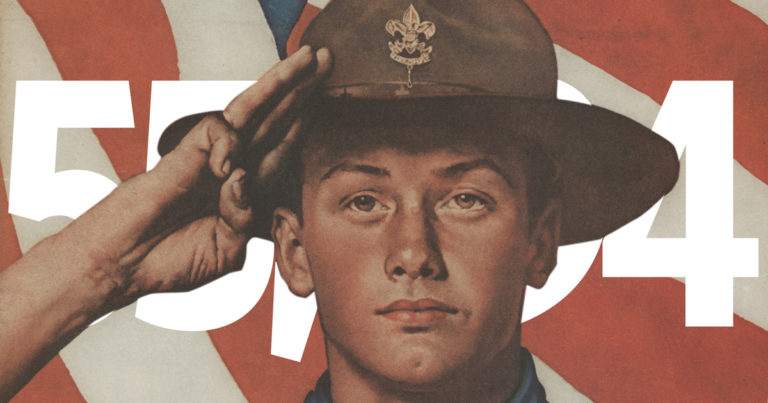
The world needs more Eagle Scouts, and 2017 delivered in a big way.
Exactly 55,494 young men became Eagle Scouts last year. That’s the most in a single year since 2013, and it’s the fourth-biggest Eagle Scout class in history (trailing 2012, 2010 and 2013).
This is great news for our country and our world. It means the planet has another 55,494 people who are prepared to be outstanding friends and coworkers, leaders and innovators, husbands and fathers.
How large was the Eagle Scout Class of 2017?
There were 55,494 Eagle Scouts in 2017. Are you having trouble wrapping your head around that number? I was, too, so I looked at the seating capacities of Major League Baseball stadiums.
The largest, Dodger Stadium in Los Angeles, holds 56,000 people. Close enough. Here’s what Dodger Stadium looks like when it’s almost full:

That’s a lot of Eagle Scouts.
A deep dive into the numbers
Let’s look at the numbers behind the numbers:
- Total number of Eagle Scout service project hours recorded in 2017
- Region-by-region Eagle numbers
- Number of Eagle Scouts per year, from 1912 to 2017
- State-by-state Eagle rankings
- The average age of 2017’s Eagle Scouts
As always, my thanks to the BSA’s Mike Lo Vecchio, who provides me with these Eagle Scout stats each year.
How many Eagle Scout service project hours were recorded in 2017?
Eagle Scouts and their volunteers completed 8,461,760 hours of service in 2017. That works out to about 152.5 hours per project.
Some might call that amount of service to communities “priceless.” But, in fact, you can put a price on it.
At the current “value of volunteer time” rate of $24.14 per hour, that works out to $204.3 million worth of service to communities.
| Year | Total Hours | Eagle Scouts | Hours per Eagle Scout project |
| 2017 | 8,461,760 | 55,494 | 152.5 |
| 2016 | 9,156,368 | 55,186 | 165.9 |
| 2015 | 8,503,337 | 54,366 | 156.4 |
| 2014 | 8,127,532 | 51,820 | 156.8 |
| 2013 | 9,347,047 | 56,841 | 164.4 |
Note: The real number is probably much higher. Many soon-to-be Eagle Scouts miscalculate the number of hours worked, thereby shortchanging themselves. Read this post for details.
What was the region-by-region breakdown?
| Region | 2013 | 2014 | 2015 | 2016 | 2017 |
| Western | 19,314 | 16,999 | 18,317 | 18,073 | 18,319 |
| Southern | 15,407 | 13,861 | 14,484 | 14,962 | 14,621 |
| Central | 11,450 | 10,681 | 10,913 | 11,017 | 11,227 |
| Northeast | 10,670 | 10,279 | 10,652 | 11,134 | 11,327 |
| Total | 56,841 | 51,820 | 54,366 | 55,186 | 55,494 |
Congrats to the Western Region for, once again, having the largest number of Eagle Scouts!
How many young men have been Eagle Scouts in past years?
In all, 2,485,473 young men have become Eagle Scouts from 1912 to 2017. That includes every Eagle Scout since the very first one: Arthur Rose Eldred in 1912.

| 1912 | 23 |
| 1913 | 54 |
| 1914 | 165 |
| 1915 | 96 |
| 1916 | 103 |
| 1917 | 219 |
| 1918 | 222 |
| 1919 | 468 |
| 1920 | 629 |
| 1921 | 1,306 |
| 1922 | 2,001 |
| 1923 | 2,196 |
| 1924 | 3,264 |
| 1925 | 3,980 |
| 1926 | 4,516 |
| 1927 | 5,713 |
| 1928 | 6,706 |
| 1929 | 6,676 |
| 1930 | 7,980 |
| 1931 | 8,976 |
| 1932 | 9,225 |
| 1933 | 6,659 |
| 1934 | 7,548 |
| 1935 | 8,814 |
| 1936 | 7,488 |
| 1937 | 7,831 |
| 1938 | 8,784 |
| 1939 | 9,918 |
| 1940 | 10,498 |
| 1941 | 9,527 |
| 1942 | 8,440 |
| 1943 | 9,285 |
| 1944 | 10,387 |
| 1945 | 10,694 |
| 1946 | 10,850 |
| 1947 | 9,733 |
| 1948 | 8,016 |
| 1949 | 9,058 |
| 1950 | 9,813 |
| 1951 | 10,708 |
| 1952 | 15,668 |
| 1953 | 9,993 |
| 1954 | 12,239 |
| 1955 | 14,486 |
| 1956 | 15,484 |
| 1957 | 17,407 |
| 1958 | 17,548 |
| 1959 | 17,360 |
| 1960 | 21,175 |
| 1961 | 24,637 |
| 1962 | 26,181 |
| 1963 | 27,428 |
| 1964 | 29,247 |
| 1965 | 27,851 |
| 1966 | 26,999 |
| 1967 | 30,878 |
| 1968 | 28,311 |
| 1969 | 31,052 |
| 1970 | 29,103 |
| 1971 | 30,972 |
| 1972 | 29,089 |
| 1973 | 46,966 |
| 1974 | 36,739 |
| 1975 | 21,285 |
| 1976 | 27,687 |
| 1977 | 24,879 |
| 1978 | 22,149 |
| 1979 | 22,188 |
| 1980 | 22,543 |
| 1981 | 24,865 |
| 1982 | 25,573 |
| 1983 | 25,263 |
| 1984 | 27,326 |
| 1985 | 27,173 |
| 1986 | 26,846 |
| 1987 | 27,578 |
| 1988 | 27,163 |
| 1989 | 29,187 |
| 1990 | 29,763 |
| 1991 | 32,973 |
| 1992 | 34,063 |
| 1993 | 33,672 |
| 1994 | 37,438 |
| 1995 | 31,209 |
| 1996 | 37,715 |
| 1997 | 40,296 |
| 1998 | 41,167 |
| 1999 | 47,582 |
| 2000 | 40,029 |
| 2001 | 43,665 |
| 2002 | 49,328 |
| 2003 | 49,151 |
| 2004 | 50,377 |
| 2005 | 49,895 |
| 2006 | 51,728 |
| 2007 | 51,742 |
| 2008 | 52,025 |
| 2009 | 53,122 |
| 2010 | 57,147 |
| 2011 | 51,933 |
| 2012 | 58,659 |
| 2013 | 56,841 |
| 2014 | 51,820 |
| 2015 | 54,366 |
| 2016 | 55,186 |
| 2017 | 55,494 |
Which states had the most Eagle Scouts?
That data gets its own post. I’ll share that soon!
What was the average age of 2017 Eagle Scouts?
I’ll share that breakdown and analysis in the coming days.
Powered by WPeMatico
